Yield Rate
What Is Yield Rate?
Yield Rate measures the percentage of outputs—whether products, assets, or processes—that meet expected quality standards without requiring rework, repair, or early replacement. It reflects how efficiently and reliably an organization delivers usable results. A high Yield Rate shows that most outputs meet performance expectations, while a low Yield Rate points to problems in procurement, production, handling, or internal workflows. Tracking Yield Rate helps organizations catch early signs of quality or process issues before they grow into larger operational or financial problems.
In IT Asset Management (ITAM), Yield Rate refers explicitly to the percentage of IT assets that successfully meet operational standards after acquisition, deployment, or configuration, without needing additional repairs or interventions.
Why Yield Rate Matters for IT Operations and Asset Tracking
Yield Rate influences the stability and efficiency of IT operations. Assets successfully deployed and functioning as intended contribute to a productive work environment and reduce the strain on IT support teams. In contrast, a drop in Yield Rate often results in a higher volume of service desk tickets, delays in equipping new employees, increased repair costs, and disruptions to essential workflows. These issues affect not just IT teams but the broader organization as well.
Beyond immediate impacts, Yield Rate plays a role in long-term planning. Monitoring it allows for more accurate forecasting of asset needs, better warranty management, and stronger control over budgeting. A consistently high Yield Rate helps minimize unplanned costs tied to early equipment failures and supports a smoother, more reliable IT environment.
How to Calculate Yield Rate for IT Assets
The formula for calculating Yield Rate is straightforward and consistent across industries:
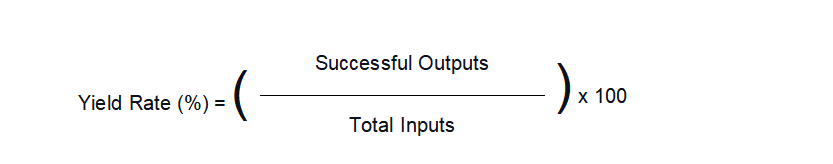
In an ITAM context:
- Successful Outputs: Assets deployed, configured, or implemented without defects, failures, or post-deployment issues.
- Total Inputs: Total assets processed, received, configured, or deployed within a defined period.
Example:
If a company receives 500 laptops and 475 of them are deployed without needing repairs, replacements, or adjustments:
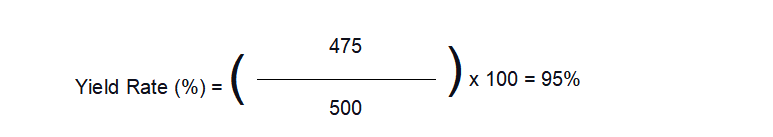
This calculation should be incorporated into regular reporting and broken down by asset category, vendor, site, and timeframe.
Common Use Cases of Yield Rate
Yield Rate can be applied across various ITAM activities and workflows:
- Procurement Quality Control: Evaluate vendor reliability by measuring how many assets arrive defect-free.
- Deployment Efficiency: Measure success rates of large-scale employee laptop, mobile device, or desktop rollouts.
- Configuration Management: Track software or hardware configurations that succeed without rework or patching.
- Asset Refurbishment Programs: Assess how many assets from a refurbishment cycle meet “like new” operational standards.
- Decommissioning and End-of-Life (EOL) Projects: Monitor the success rate of secure data wipes, environmental recycling, and compliance with retirement policies.
- Warranty Return Management: Analyze trends in defects to strengthen warranty negotiations and claims processes.
Factors That Affect Yield Rate in IT Asset Management
Several factors either support or hinder a strong Yield Rate. Awareness and control over these factors improve asset outcomes and cost management.
- Vendor Quality and Manufacturing Consistency: Poorly manufactured hardware and inconsistent production runs lower yield.
- Shipping, Handling, and Storage Conditions: Damaged goods during transportation or warehouse storage impact asset quality.
- Internal Processes and Inspections: Lapses in receiving inspections, asset tagging, or configuration standards lower first-pass success rates.
- Environmental Deployment Conditions: High-risk environments such as warehouses, outdoor facilities, or temporary worksites increase early failures.
- End-User Training and Care: Users unaware of best practices for device care may cause accidental damage, reducing effective yield.
- Systemic Process Failures: Gaps in project planning, onboarding protocols, or ITAM system updates can introduce avoidable errors.
Recognizing these influences allows organizations to tighten controls at multiple points in the asset lifecycle.
Yield Rate vs. Failure Rate: Understanding the Difference
In IT asset management, tracking only successful assets gives an incomplete picture. You also need to understand where things fall short. Yield Rate and Failure Rate offer complementary views—one measures how many assets meet expectations, and the other highlights where failures occur. Together, they provide a fuller understanding of asset quality and process effectiveness. The table below outlines their key differences:
| Aspect | Yield Rate | Failure Rate |
|---|---|---|
| Definition | Percentage of assets that meet operational expectations | Percentage of assets that fail to meet operational expectations |
| Perspective | Highlights operational success and effectiveness | Highlights issues, defects, and risk areas |
| Formula | Yield Rate= (Number of Successful Outputs / Total Inputs) × 100 | Failure Rate (%) = 100% – Yield Rate (%) |
| Example | 97% Yield Rate | 3% Failure Rate |
| Use in ITAM | Tracks successful deployments, configurations, and handoffs | Tracks defective, delayed, or reworked assets |
| Value to Organizations | Reflects quality and process strength | Identifies areas for process, vendor, or quality improvement |
Teqtivity helps you track Yield and Failure Rates with real-time reporting, vendor insights, and lifecycle analytics—so you can reduce costs, improve deployment success, and make smarter decisions. Request a demo to see how it works.
How Low Yield Rates Impact IT Costs and Productivity
The consequences of low Yield Rates extend across finance, operations, compliance, and employee experience. When the rate of successful asset deployments declines:
- Repair Costs Soar: Defective or malfunctioning assets drive maintenance, parts, and labor expenses.
- Employee Downtime Rises: Asset-related disruptions reduce employee work hours and output.
- Helpdesk Burden Increases: More assets in trouble generate higher job ticket volumes, draining IT support resources.
- Budget Overruns Accumulate: Costs associated with re-procurement, warranty claims, loaner devices, and expedited shipping add up.
- Compliance and Audit Risks Grow: Failing to meet service standards or data protection requirements can lead to audit findings or penalties.
- Vendor Management Becomes Tense: Repeated issues erode trust and increase administrative overhead related to contract enforcement.
A consistently low Yield Rate is a symptom of deeper process, quality, or governance issues that require cross-functional attention.
Best Practices to Improve Yield Rate in IT Asset Management
To drive higher Yield Rates and stronger asset programs, organizations should integrate these best practices:
- Vet and Certify Vendors Rigorously: Go beyond price comparisons and evaluate vendor quality certifications, defect rates, and references.
- Formalize Receiving Inspections: Standardize asset inspections upon arrival, capturing detailed condition reports.
- Create Consistent Deployment Templates: Build uniform hardware and software imaging and setup procedures.
- Automate Routine Processes: Implement automated device enrollment, patch management, and asset tagging systems.
- Educate End-Users: Conduct onboarding sessions or quick reference guides on proper asset handling and reporting procedures.
- Audit and Review Yield Metrics Regularly: Build Yield Rate reporting into ITAM dashboards, reviewing by vendor, asset type, location, and project.
- Negotiate Warranty Clauses Smartly: Secure service level agreements (SLAs) that penalize chronic failure rates or reward high-quality delivery.
The Role of Procurement and Vendors in Yield Rate Performance
Procurement departments and supplier relationships are crucial in shaping Yield Rates.
Procurement responsibilities include:
- Defining and enforcing asset quality standards in contracts
- Conducting supplier audits and quarterly business reviews (QBRs)
- Mandating defect reporting and early-failure statistics
- Enforcing penalties or non-payment clauses for poor performance
Vendor expectations include:
- Delivering products that meet specifications and compliance requirements
- Transparently sharing defect rates and resolution processes
- Supporting rapid replacement, warranty fulfillment, and escalations
- Continuously improving production and logistics standards based on feedback
Organizations can proactively manage operational risks by aligning procurement practices with Yield Rate goals.
Glossary of Related Terms
- Asset Utilization
- Cybersecurity
- Discovery Tools
- Information Security Management System (ISMS)
- Inventory Management
- Inventory Reconciliation
- Mobile Assets
- Physical Count
- Software Asset Management (SAM)
- Total Cost of Ownership (TCO)
- User
- User Discrepancy
Frequently Asked Questions
-
What is considered a good Yield Rate in ITAM?
-
A "good" Yield Rate often falls above 95%, with critical industries like healthcare, aviation, or finance aiming for 98% or higher to ensure uninterrupted service and regulatory compliance.
-
Can Yield Rate vary between asset types?
-
Absolutely. High-complexity devices like workstations, servers, and mobile devices tend to have slightly lower Yield Rates than simple peripherals like keyboards or docks.
-
How does Teqtivity support Yield Rate improvement?
-
Teqtivity improves Yield Rate by tracking asset performance from procurement to decommissioning. It offers real-time monitoring, automates inspections, and highlights failure trends, helping teams quickly address issues and reduce defects.
-
Should organizations track both Yield Rate and Failure Rate?
-
Yes. Dual tracking helps highlight both performance strengths and vulnerabilities, supporting better reporting to stakeholders and smarter strategic decisions.
-
Does Yield Rate impact IT compliance audits?
-
Indirectly, yes. High Yield Rates support consistent policy adherence, reduce instances of non-compliant configurations, and strengthen audit documentation.
-
Can environmental conditions be factored into Yield Rate reporting?
-
Yes. Filtering Yield Rate reports by deployment environment, usage conditions, or geographical location produces more realistic performance benchmarks.
-
What happens if vendors consistently cause low Yield Rates?
-
To protect operational stability, organizations should escalate issues formally, conduct a supplier review, seek remediation, or transition to alternative vendors.
-
How often should the Yield Rate be reviewed?
-
Yield Rates should be reviewed quarterly at a minimum. Large projects or strategic deployments warrant immediate post-implementation review.
-
Is there a connection between Yield Rate and asset lifecycle management?
-
Yes. Assets with strong initial performance typically experience smoother lifecycle transitions, require fewer repairs, and hold greater residual value.
-
Can improving Yield Rate help with sustainability goals?
-
Yes. Fewer repairs, returns, and replacements reduce waste generation, shipping emissions, and resource consumption, supporting broader ESG initiatives.